


PostGIS Overlays
30 Jul 2019One question that comes up often during our PostGIS training is “how do I do an overlay?” The terminology can vary: sometimes they call the operation a “union” sometimes an “intersect”. What they mean is, “can you turn a collection of overlapping polygons into a collection of non-overlapping polygons that retain information about the overlapping polygons that formed them?”
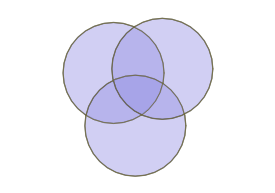
So an overlapping set of three circles becomes a non-overlapping set of 7 polygons.
Calculating the overlapping parts of a pair of shapes is easy, using the ST_Intersection() function in PostGIS, but that only works for pairs, and doesn’t capture the areas that have no overlaps at all.
How can we handle multiple overlaps and get out a polygon set that covers 100% of the area of the input sets? By taking the polygon geometry apart into lines, and then building new polygons back up.
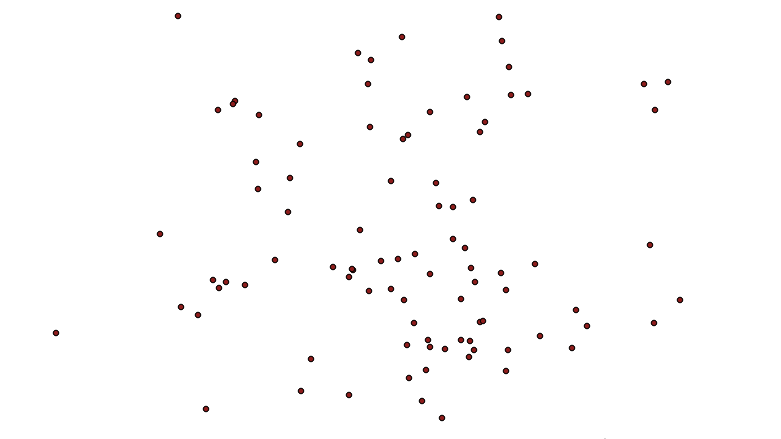
Let’s construct a synthetic example: first, generate a collection of random points, using a Gaussian distribution, so there’s more overlap in the middle. The crazy math in the SQL below just converts the uniform random numbers from the random() function into normally distributed numbers.
CREATE TABLE pts AS
  WITH rands AS (
  SELECT generate_series as id,
         random() AS u1,
         random() AS u2
  FROM generate_series(1,100)
)
SELECT
  id,
  ST_SetSRID(ST_MakePoint(
    50 * sqrt(-2 * ln(u1)) * cos(2*pi()*u2),
    50 * sqrt(-2 * ln(u1)) * sin(2*pi()*u2)), 4326) AS geom
FROM rands;
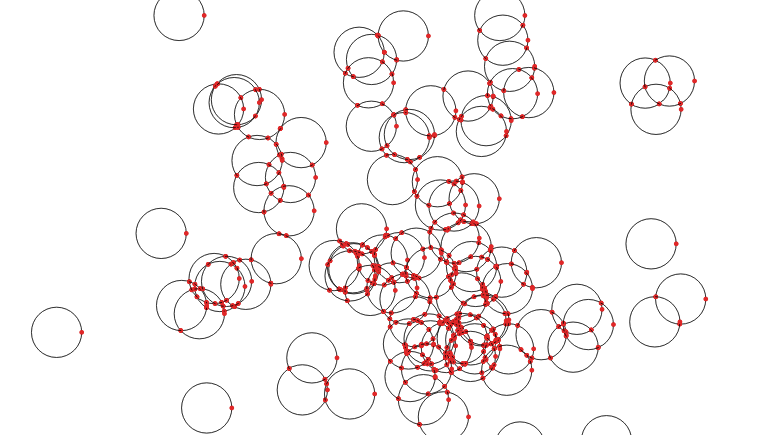
The result looks like this:
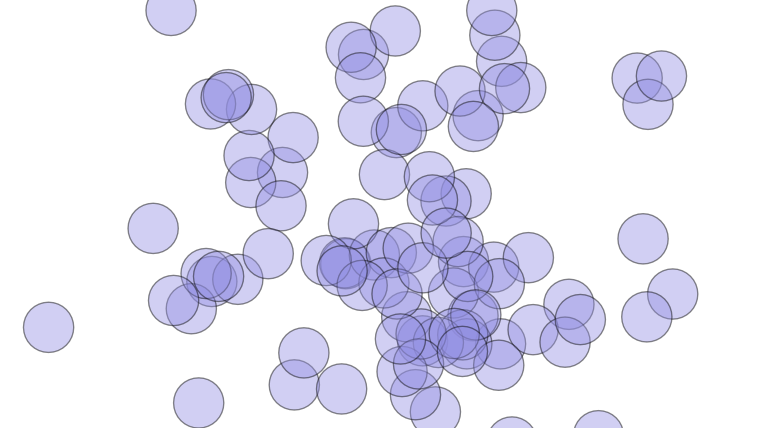
Now, we turn the points into circles, big enough to have overlaps.
CREATE TABLE circles AS
  SELECT id, ST_Buffer(geom, 10) AS geom
    FROM pts;
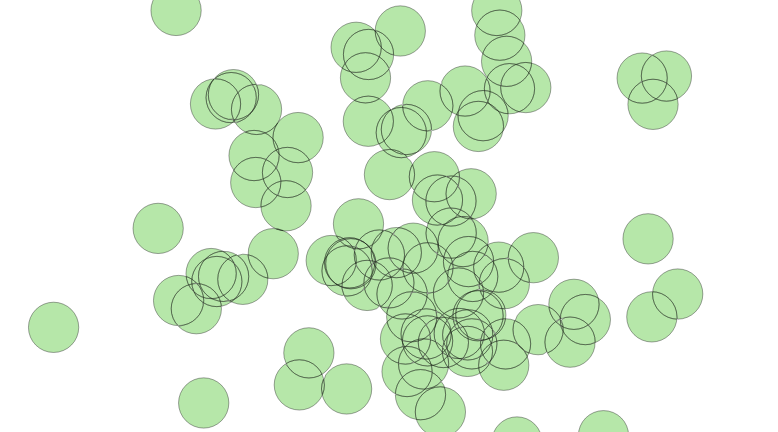
Which looks like this:
Now it’s time to take the polygons apart. In this case we’ll take the exterior ring of the circles, using ST_ExteriorRing(). If we were dealing with complex polygons with holes, we’d have to use ST_DumpRings(). Once we have the rings, we want to make sure that everywhere rings cross the lines are broken, so that no lines cross, they only touch at their end points. We do that with the ST_Union() function.
CREATE TABLE boundaries AS
  SELECT ST_Union(ST_ExteriorRing(geom)) AS geom
    FROM circles;
What comes out is just lines, but with end points at every crossing.
Now that we have noded lines, we can collect them into a multi-linestring and feed them to ST_Polygonize() to generate polygons. The polygons come out as one big multi-polygon, so we’ll use ST_Dump() to convert it into a table with one row per polygon.
CREATE SEQUENCE polyseq;
CREATE TABLE polys AS
  SELECT nextval('polyseq') AS id,
         (ST_Dump(ST_Polygonize(geom))).geom AS geom
  FROM boundaries;
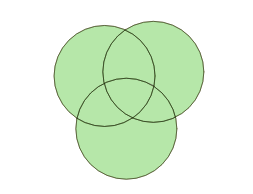
Now we have a set of polygons with no overlaps, only one polygon per area.
So, how do we figure out how many overlaps contributed to each incoming polygon? We can join the centroids of the new small polygons with the set of original circles, and calculate how many circles contain each centroid point.
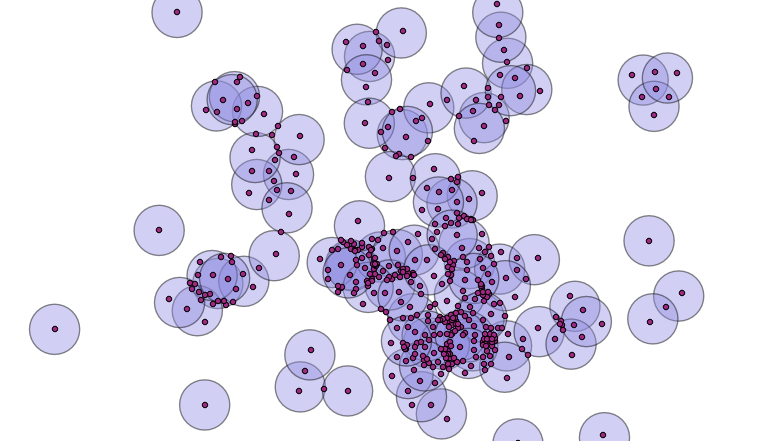
A spatial join will allow us to calculate the number of overlaps.
ALTER TABLE polys ADD COLUMN count INTEGER DEFAULT 0;
UPDATE POLYS set count = p.count
FROM (
  SELECT count(*) AS count, p.id AS id
  FROM polys p
  JOIN circles c
  ON ST_Contains(c.geom, ST_PointOnSurface(p.geom))
  GROUP BY p.id
) AS p
WHERE p.id = polys.id;
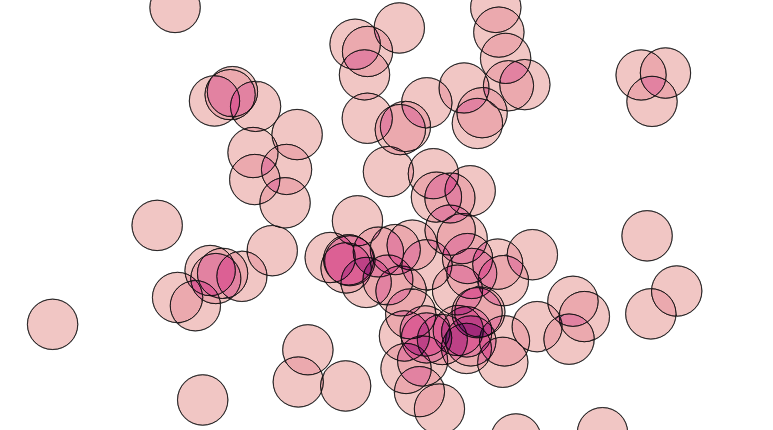
That’s it! Now we have a single coverage of the area, where each polygon knows how much overlap contributed to it. Ironically, when visualized using the coverage count as a variable in the color ramp, it looks a lot like the original image, which was created with a simple transparency effect. However, the point here is that we’ve created new data, in the count attribute of the new polygon layer.
The same decompose-and-rebuild-and-join-centroids trick can be used to overlay all kinds of features, and to carry over attributes from the original input data, achieving the classic “GIS overlay” workflow. Happy geometry mashing!