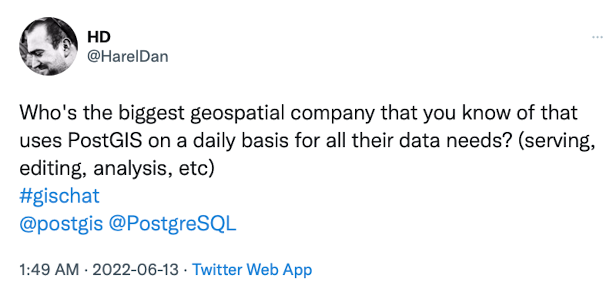
Last week, I wrote that getting large organizations to cop to using PostGIS was a hard lift, despite that fact that, anecdotally, I know that there is massive use of PostGIS in every sector, at every scale of institution.
Simple Clues
Here’s a huge tell that PostGIS is highly in demand: despite the fact that PostGIS is a relatively complex extension to build (it has numerous dependencies) and deploy (the upgrade path between versions can be complex) every single cloud offering of PostgreSQL includes PostGIS.
If PostGIS was a niche hobbyist project…? Complete the sentence any way you like.
Logos
True to form, I received a number of private messages from people working in or with major institutions you have heard of, confirming their PostGIS use, and the fact that the institution would not publicly validate it.
However, I also heard from a couple medium sized companies, which seem to be the only institutions willing to talk about how useful they find open source in growing their businesses.
Foundry Spatial uses PostGIS in development and production. In development we use it as our GIS processing engine and warehouse. We integrate spatial data (often including rasters that have been loaded into PostGIS) into a watershed fabric and process summaries for millions of watersheds across North America. We often use it in production with open source web tooling to return results through an API based on user input. One of our more complex usages is to return raster results within polygons and along networks within a user supplied distance from a click location. We find the ease and power of summarizing and analyzing many spatial datasets with a single SQL query to be flexible, performant, efficient, and… FUN!
We use PostGIS at Understory to track and record storms, manage fleets of weather stations, and optimize geographic risk concentration for insurance. PostGIS lets us do all this with the database tools we already know & love, and without severing the connections between geographic and other categories of information.
The question of “who uses PostGIS” or “how big is PostGIS” or “how real is PostGIS” is one that we have been wrestling with literally since the first public release back in 2001.
There is no doubt that institutional acceptance is the currency of … more institutional acceptance.
So naturally, we would love to have a page of logos of our major users, but unfortunately those users do not self-identify.
As an open source project PostGIS has a very tenuous grasp at best on who the institutional users are, and things have actually gotten worse over time.
Originally, we were a source-only project and the source was hosted on one web server we controlled, so we could literally read the logs and see institutional users. At the time mailing lists were the only source of project communication, so we could look at the list participants, and get a feel from that.
All that’s gone now. Most users get their PostGIS pre-installed by their cloud provider, or pre-built from a package repository.
So what do we know?
IGN
In the early days, I collected use cases from users I identified on the mailing list. My favourite was our first major institutional adopter, the Institut Géographique National, the national mapping agency of France.
In 2005, they decided to move from a desktop GIS paradigm for their nation-wide basemap (of 150M features), to a database-centric architecture. They ran a bake-off of Oracle, DB2 and PostgreSQL (I wonder who got PostgreSQL into the list) and determined that all the options were similar in performance and functionality for their uses. So they chose the open source one. To my knowledge IGN is to this day a major user of PostgreSQL / PostGIS.
GlobeXplorer
Though long-gone as a brand, it’s possible the image management system that was built by GlobeXplorer in the early 2000’s is still spinning away in the bowels of Maxar.
GlobeXplorer was both one of the first major throughput use cases we learned about, and also the first one where we knew we’d displaced a proprietary incumbant. GlobeXplorer was one of the earliest companies explicitly serving satellite imagery to the web and via web APIs. They used a spatial database to manage their catalogue of images and prepared product. Initially it was built around DB2, but DB2 was a poor scaling choice. PostGIS was both physically faster and (more importantly) massively cheaper as scale went up.
RedFin
RedFin was a rarity, a use case found in the wild that we didn’t have to track down ourselves.
They described in some detail their path from MySQL to PostgreSQL, including the advantages of having PostGIS.
Using PostGIS, we could create an index on centroid_col, price, and num_bedrooms. These indexes turned many of our “killer” queries into pussycats.
Google
Google is not that big on promoting any technology they haven’t built in house, but we have heard individual Google developers confirm that they use core open source geospatial libraries in their work, and that PostGIS is included in the mix.
The biggest validation Google ever gave PostGIS was in a press release that recognized that the set of “users of spatial SQL” was basically the same as the set of “PostGIS users”.
Our new functions and data types follow the SQL/MM Spatial standard and will be familiar to PostGIS users and anyone already doing geospatial analysis in SQL. This makes workload migrations to BigQuery easier. We also support WKT and GeoJSON, so getting data in and out to your other GIS tools will be easy.
They didn’t address their new release to “Esri users” or “Oracle users” or “MySQL users”, they addressed it to the relevant population: PostGIS users.
More!
Getting permission to post logos is hard. Really hard. I’ve watched marketing staff slave over it. I’ve slaved over it myself.
Major automaker? Check. Major agricultural company? Check. Major defence contractor? Check, check, check. National government? Check. State, local, regional? Check, check, check. Financial services? Check. Management consulting? Check.
Yes, PostGIS is real.
At some point, for a project with a $0 price point, you just stop. If a user can’t be bothered to do the due diligence on the software themselves, to reap all the advantages we offer, for free, I’m not going to buy them a steak dinner, or spoon feed them references.
That said! If you work for a major government or corporate institution and you are allowed to publicize your use of PostGIS, I would love to write up a short description of your use, for the web site and our presentation materials.
Over a year ago Chris Holmes, the driving force behind the “cloud optimized GeoTIFF” (COG) and “spatio-temporal asset catalog” (STAC) standards that are sweeping the “cloud optimized raster” data management world, asked me what I thought the story of a similar “cloud optimized vector” format might look like.
And I thought about COG, which is really just a very very old format (GeoTIFF) with its bytes rearranged so that the order of bytes in the file matches the likely order in which they will be accessed (blocks of bands, and within the bands, squares of pixels), and I thought I had the perfect, maximally snarky answer:
Dude, shape file is already a cloud-native format.
Now, this might seem counter-intuitive, but hear me out:
Shape format hails from the early 90’s, when hard-disks spun very slowly, and the limiting factor for data access was usually I/O. Which is much like “cloud optimized” range access over HTTP: seeks are expensive, but block reads are cheap.
Shape format already divies up the attributes and shapes into separate files, so you can render one without reading the other.
Shape format is already “network safe”, with endianness defined in the format.
Shape format is already universally supported. The specification is 24 years old, and it has been the de facto interchange format for so long that people make a joke out of it.
In short, shapefile already looks a lot like GeoTIFF, the founding format of the “cloud optimized geospatial” movement.
Let’s Get Real
So, what is missing to make “cloud optimized shapefile” a reality?
Well, in order to spatially search a shapefile you need a spatial index. There is no index format in the formal Esri specification, and the Esri sbx index format is proprietary (though largely reverse engineered at this point) but the open source world has had a shape file index format for 20 years: the “QIX file”.
You generate a QIX file using the shptree utility in Mapserver. You can also generate one in GDAL. You can also get GeoTools to generate one.
With a QIX file, the “shape file” now consists of four files:
shp, the binary shapes
dbf, the table of attributes
shx, a file index of the byte offsets of each shape in the shp file
qix, a spatial index of the shapes
The next trick, just as in COG, is to put the main data files (shp, dbf and shx) into the same order they are likely to be searched in: spatial order.
Since we already have a spatial index (qix), we can get the files in spatial order by re-writing them in the same order they appear in the index.
Initially I told Chris that this could be done with the Mapserver sortshp utility, however I was mistaken: sortshp sorts the file in attribute order.
To make “cloud optimized shape file” a reality, first we need a new utility program that sorts the shp, shx and dbf files into qix order.
coshp is just a re-working of the sortshp utility, but instead of sorting the output file by attribute it sorts it using the index tree as the driver. This results in shp and dbf files where shapes that are “near” in space are also “near” in the byte-stream of the file. This will reduce the number of random reads necessary to access portions of the file using a bounding box search.
Not Even Remotely Done
One of the quiet secrets of the “cloud optimized” geospatial world is that, while all the attention is placed on the formats, the actual really really hard part is writing the clients that can efficiently make use of the carefully organized bytes.
For example, the fancy demonstrations of “pure client-side” COG browsers require a complete GeoTIFF reader in Javascript, along with some extra “cloud” smarts to know what pieces of data to cache and what to treat as transient info during rendering.
So, spatially sorting a shape file is a necessary, but not at all sufficient condition to create an actual “cloud optimized shapefile”, because for it to be practically useful, there needs to be at a minimum a client-side javascript reader.
To be truly useful, the javascript should probably include enough cloud smarts to read and opportunistically cache pieces of the files: headers at a minimum, but also reading in branches of the qix and shx indexes on-demand.
To make things marginally easier, I have “documented” the QIX format. It’s an ugly beast, but it is possible to traverse it without deserializing the whole thing.
It’s a challenging problem, but I hope there is someone with enough nostalgia for old formats and thirst for glory to make it happen.
One of the crazy things about actuarial probability is that if you get a large enough population of people together, the odds that something unlikely will happen to any one of them really go up fast. They can get hit by lightning, crushed by a vending machine, killed by a tiger, or more prosaicly suffer a stroke at the age of 49 as Democratic Senator Ben Ray Luján did today (apparently and hopefully he will be fine).
The news last week that US Justice Breyer will resign, and that his replacement can only be confirmed if the entirety of the US Democratic Senate Caucus remains healthy, led me to dust off an old macabre political analysis of group mortality: “what are the odds that the one or more members of the Democratic Senate Caucus will die in the next year”.
Basically the whole thing turns on a pretty simple statement of group probability. The odds that one or more members of a group will die is equal to the inverse of the odds that all members of the group will stay alive.
And the odds of N independent events all happening (like all members of a group staying alive for a period of time) is just the product of all probabilities of each individual event.
To answer the question for the Senate, we just need a few easily sourced pieces of data:
The ages and sexes and parties of all the Senators, from Wikipedia.
Then we can easily construct a spreadsheet to answer the pressing actuarial question of the day.
Probability of one or more Senators dying in next 12 months
Population
Probability
All Parties
87.8%
Democratic
63.0%
Republican
67.1%
D Senator + R Governor
32.3%
R Senator + D Governor
18.4%
It’s been a while since I took probability, but this strikes me as an easy one so I don’t think I got it wrong.
Long story short, a caucus made up of 50 quite old people has a really surprisingly high probability of suffering a death in any given year. The population level Social Security tables probably overstate the mortality of the Senate members though, since Senators are all wealthier than the average American and thus have access to better medical care and generally healthier living conditions.
I have not done the year-end blog post very often, but it’s cold and snowy outside, I have my toes under a knit blanket, and like Oprah I feel like sharing some of my favourite things.
I spent a lot of time in the gym as a young man, and for a while I had the shoulders to prove it, but as is the nature of things over time I invested less time in my physique (and more in family and work) so the muscles mostly melted away.
I always missed the post-gym feeling, but while I accumulated the start of a home gym over the years, I never gave it a lot of use, until Covid came. Working from home, the garage gym is only ever a flight of stairs away, so putting in 3 or 4 hours a week is not too hard.
My overarching goal is to exercise 7 hours a week, so I do 3 or 4 hours of strength training, and fill in the remaining hours with yoga, rowing, walking or (until an injury this spring) running.
In terms of positive returns, this has been one of the best investments I have made in the past 10 years. I sleep better, my formerly sore back is no more, and I have a body that would make my 35-year-old self green with jealousy.
It also turns out I’m in the vanguard of the conventional wisdom! The New York Times seems to publish a newstudy on the superior health benefits of strength training every day.
There is a huge amount of information online about getting started, and I have only one non-conventional piece of advice for new folks: no matter what your age, look at the “weight training over 50” articles. The routines for older people tend to stress “full chain” movements (squats, pull-ups, push-ups) and slower progressions to avoid injury. The result is a stronger core and back which are a key foundation to build general fitness. (And supplemental, be sure to read Zeynep Tufekci’s amazing article on the lies the exercise industry tells women and how everyone can get strong.)
Finally (this has gotten long) doing yoga regularly has allowed me to strengthen all kinds of tiny muscles I never knew I had, but that turn out to be critical to core strength useful in other strength training moves. Since Covid shut my local yoga studio I have been using the Down Dog app on my phone to guide my sessions, which has been money well spent.
Revolutions Podcast
There’s probably an entry for this in the Stuff White People Like (the Stuff Older White Guys Like?) but c’est la vie: Mike Duncan’s Revolutions Podcast has been a constant companion both in the garage gym and while out walking Victoria’s lovely coastline.
Duncan is currently wrapping up his tenth revolution (the Russian revolutions) and this series has been the work of multiple years so there are hundreds of episodes of content.
English Revolution (16 episodes)
American Revolution (15 episodes)
French Revolution (55 episodes)
Haitian Revolution (19 episodes)
Spanish American wars of independence (27 episodes)
July Revolution (7 episodes)
Revolutions of 1848 (33 episodes)
Paris Commune (8 episodes)
Mexican Revolution (27 episodes)
Russian Revolution (70+ episodes)
I found that for historical periods I knew something about, like the French Revolution, the podcast filled in the 90% that I was missing, and it was enthralling stuff. The Revolutionary wars in Europe, the ebb and flow of the power of the Parisian street, the whole period of the Directory! Turns out that just reading Tale of Two Cities doesn’t give you enough backgrounding in the Revolution.
Revolutions would be worth a listen just for the extra context and detail on things I already knew, but the real eye openers have been the revolutions I knew basically nothing about.
OK, I knew there was a Haitian revolution. A slave uprising, right? That’s the sum total I went in with. Revolutions has 19 episodes on the Haitian revolution, and the whole thing is amazing. Tragic, uplifting, depressing, hair-tearing, absolutely worth knowing about.
Similarly the Mexican revolution. Sure, there had to have been one, right? Pancho Villa, he’s a guy who did some stuff? I’m in the midst of it now (Revolution number 9) and the historical echoes into the present day are eerie.
Anyways, the Revolutions Podcast, give it a try. Middle aged white guys and everyone else.
Ursula Le Guin
Not for the first time, but returning to Le Guin this year has been very comforting. Her prose is so clear and unfussy and easy to read, yet also contains so much beauty and observation. In particular I have enjoyed revisiting:
The Dispossessed, which structurally owes a lot to Siddhartha or The Glass Bead Game. The life story of a philosopher finding his way to understanding. But this philosopher lives in a world of perfect equality, a world-wide anarcho-syndicalist society, and as in all (good) sci-fi the fun is in unravelling the ways humans live in this totally foreign millieu.
The Found and the Lost, a huge collection of novellas, ranging from sci-fi pieces set in the Hainish universe to fantasy pieces in Earthsea. They are all excellent, but the one that sticks with me the most is Matter of Segri. A world in which there are 16 women for every man, and the men are kept separate in “castles” from the age of 12 on, “castles” within which they form elabourate dominance heirarchies, torment each other, and practice displays of strength. So, like, a total fantasy cough.
Art Tatum
I am a half-assed jazz pianist, and my interest in the details of the art form comes and goes, but at some point I heard someone say that, if you want to understand jazz piano you have to listen to Art Tatum. In particular, listen to the embellishments.
So I did.
The first thing that hits you is the technical perfection of his playing. Every scale, every arpeggio, the incredible regulation of his touch. I mean, listening to professional piano players, of course the technique is amazing, but Tatum is a notch above.
The second thing, particularly in the early work, where he’s just banging out popular tunes of the time, is the ad-libbed fills and transitions, the embellishments. The harmonic structure he uses often feels appropriate to recordings from 10 or 15 years later on. I totally get where the commentator I read was coming from: Tatum is a precursor to later players.
Check out this jaunty stride rendition of Tea for Two. Crazy fills and asides, and getting increasingly harmonically fun as the piece goes on. Three minutes of happiness.
Anyways, make some time in your streaming playlist for Art Tatum.


 Hailey Eckstrand of Foundry Spatial writes to say: