I’m a cowboy. I like to just slap a brand on the cattle and push them out the gate. Sometimes this gets me in trouble.
Jesse Eichar, the uDig project lead, is not a cowboy. The 1.1.0 release comes after a series of 14 (fourteen) “RC” versions and three “SC” versions. Congratulations to Jesse, and to Jody and Andrea and other uDig team members, on “going gold” with the 1.1 release. Remember, if things aren’t perfect, there’s always 1.1.1!
One thing watching the uDig development process has taught me over the years is how much harder user-facing applications are than server-side ones. The number of places you can “get it wrong” is orders of magnitude greater. The number of ways you can fine tune and fine tune and fine tune a particular piece of interaction is almost infinite (the editing tools are something like major revision four since the project started, and I’m sure there will still be things to be changed and fiddled with, given the hyper-modality and hyper-interactivity of editing). It has given me a lot more respect for the people writing web browsers and word processors and all the other virtual tools that we use every day. And now I automatically quadruple estimates that involve user interfaces, instead of merely doubling them as I used to.
Update: A timely review of uDig, posted at the Linux Journal.
The “cost of the bailout” has been a big election meme south of the border, and I continue to be flabbergasted at how primitive the media discussion of the issue has been. The first debate event began with a question that essentially said “given the $700B cost of the bailout, what parts of your campaign platform would you cut to pay for it?”.
How about: none of it. How about: tell you what, I’m going to spend more.
The US of A is going to sell $700B worth of Treasury Bills (bonds) to various countries, institutions and people – China, Saudi princes, sovereign wealth funds, foreign banks, and so on. For short, we’ll call them “the Suckers”. These bonds are going to pay the Suckers some absurdly low interest rate, like 2% or less.
The US of A is then going to turn around and exchange the $700B it got from the Suckers for preferred shares in the banks, which will pay 5% for the first five years, and 10% after that.
So, rather than costing the benighted tax payers of the USA anything, this “bailout” is actually going to be netting the Treasury $700B * 3% = $21B a year. The only people with anything to complain about might be the Suckers, and it’s not like anyone is forcing them to buy Treasury Bills.
Why is this rather elementary fact not finding its way into the political discussion of the “bailout”? Too much math?
Martin Davis just posted about his improvements to the JTS buffering routines, speeding up buffering by a mere factor of 20 or so.
Martin has also added some improvements in the area of unions for large sets of geometries, a technique he calls “cascaded union”. It too is good for orders-of-magnitude performance improvements.
If you do, then getting Martin’s JTS algorithms ported to GEOS (the C++ geometry library used by PostGIS) will make your database run faster. Lots faster.
How can you help that happen? Become an OSGeo “Project Sponsor” for GEOS. Project sponsor commit a modest sum to the ongoing maintenance of the code, which is generally used for hiring a maintainer to do things like ensure patches are properly integrated, that tests are added for reliability, and that upgrades like the ones Martin has created get folded into the code base in a timely manner.
If you’re interested in sponsoring GEOS development, please get in touch with me. If you are using PostGIS in your business, it is money well spent.
Happy voting day, Canadians. I’m just about to head out my local polling place to nullify somebody’s vote by casting an equal, opposite vote (I like to identify them in line, for maximum enragement. “Oh, you’re voting Conservative? I’m voting NDP, so you might as well have not even bothered coming.”)
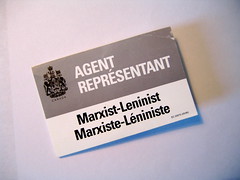
I wouldn’t be a Canadian if I didn’t take this opportunity to point out how this day demonstrates (yet again) how superior we are to our cousins to the south. We started our election later than them (September 9), but we’re still finishing first. I will not have to spend three hours in line to vote. I will vote using a pencil and paper, not a touch screen doohickey. We have four national parties to choose from (five, if you’re from Quebec and think Quebec is a nation) instead of two. We also have lots of other great options on the ballot, for those who like to get off the beaten path (see right). And we don’t just have hockey moms running for office, but honest-to-god hockey players.
The credit crisis is spilling over into the grain industry as international buyers find themselves unable to come up with payment, forcing sellers to shoulder often substantial losses.
Before cargoes can be loaded at port, buyers typically must produce proof they are good for the money. But more deals are falling through as sellers decide they don’t trust the financial institution named in the buyer’s letter of credit, analysts said.
I think everyone should take a deep breath and go read Roosevelt’s first inaugural, both for a perspective on how much worse things can get, and the mindset needed to address these things.
So, first of all, let me assert my firm belief that the only thing we have to fear is fear itself–nameless, unreasoning, unjustified terror which paralyzes needed efforts to convert retreat into advance. In every dark hour of our national life a leadership of frankness and vigor has met with that understanding and support of the people themselves which is essential to victory. I am convinced that you will again give that support to leadership in these critical days.
In such a spirit on my part and on yours we face our common difficulties. They concern, thank God, only material things. Values have shrunken to fantastic levels; taxes have risen; our ability to pay has fallen; government of all kinds is faced by serious curtailment of income; the means of exchange are frozen in the currents of trade; the withered leaves of industrial enterprise lie on every side; farmers find no markets for their produce; the savings of many years in thousands of families are gone.
And it goes on… For something delivered 75 years ago, it feels surprisingly topical.


 Jesse Eichar, the uDig project lead, is not a cowboy. The 1.1.0 release comes after a series of 14 (fourteen) “RC” versions and three “SC” versions. Congratulations to Jesse, and to Jody and Andrea and other uDig team members, on “going gold” with the 1.1 release. Remember, if things aren’t perfect, there’s always 1.1.1!