


Riding the Shark
12 May 2008My annoyance at learning that OS/X 10.5 doesn’t really support gprof has turned into ecstasy at finding the wholly superior Shark profiler that comes with XCode.
Unlike gprof, Shark doesn’t require that you compile with special profiling flags, it can run on unaltered binaries. In fact, Shark doesn’t even require that you run it against any binary in particular! You can run it against everything on your system, then view the profile of any process post-facto.
I just did a profile of Mapserver running as a FastCGI process, just by running some load against Mapserver and letting Shark collect statistics on all processes at once. Then I pick the mapserv.fcgi process from the sample data, and voila!
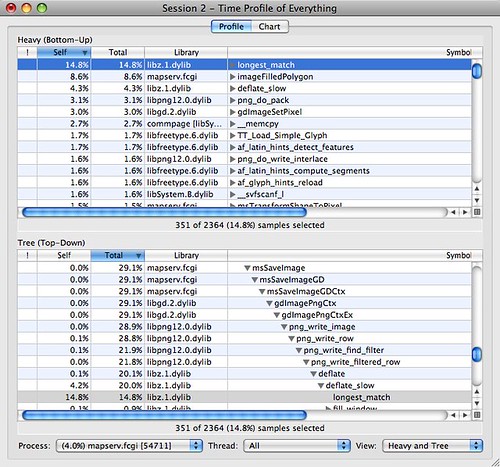
I can see that the most costly small function is longest_match, from the bottom-up view at the top, and that it is called in the image saving routines, in the top-down view at the bottom. Good news, Mapserver is so efficient that the biggest cost is compressing the output image.
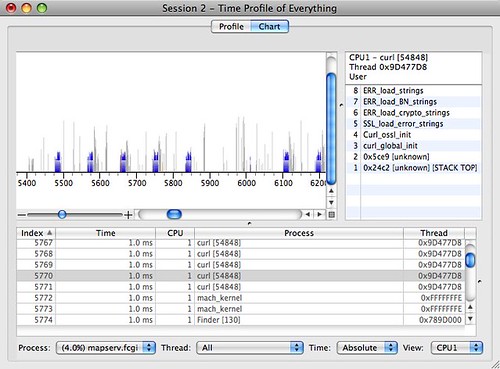
Even cooler, I can flip to chart view and see what the CPUs were doing throughout the sample period. The blue spikes are mapserv.fcgi calls.
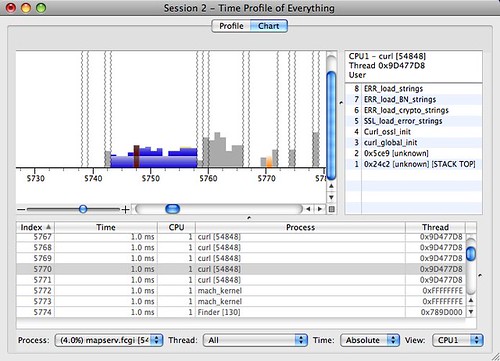
Zoom into one of those, and we can see the CPU ticks through one map draw, including the kernel (the red bit) taking a slice out. End to end, Mapserver is taking about 15ms to draw this particular map.
In addition to the “Time Profile” mode I’m showing here, there’s also a “Java Time Profile”. I wonder if Java developers can make use of this excellent tool too?