


Waiting for PostGIS 3: Separate Raster Extension
22 Aug 2019The raster functionality in PostGIS has been part of the main extension since it was introduced. When PostGIS 3 is released, if you want raster functionality you will need to install both the core postgis extension, and also the postgis_raster extension.
CREATE EXTENSION postgis;
CREATE EXTENSION postgis_raster;
Breaking out the raster functionality allows packagers to more easily build stripped down “just the basics” PostGIS without also building the raster dependencies, which include the somewhat heavy GDAL library.
The raster functionality remains intact however, and you can still do nifty things with it.
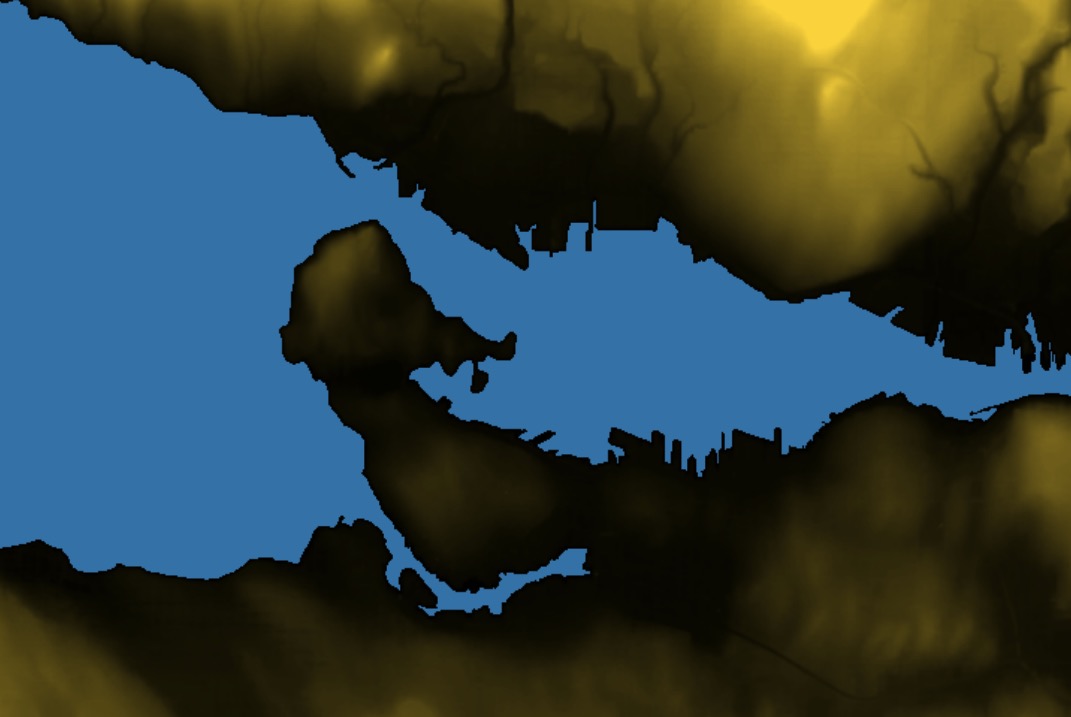
For example, download and import a “digital elevation model” file from your local government. In my case, a file that covers the City of Vancouver.
# Make a new working database and enable postgis + raster
createdb yvr_raster
psql -c 'CREATE EXTENSION postgis' yvr_raster
psql -c 'CREATE EXTENSION postgis_raster' yvr_raster
# BC open data from https://pub.data.gov.bc.ca/datasets/175624/
# Download the DEM file, unzip and load into the database
wget https://pub.data.gov.bc.ca/datasets/175624/92g/092g06_e.dem.zip
unzip 092g06_e.dem.zip
# Options: create index, add filename to table, SRID is 4269, use 56x56 chip size
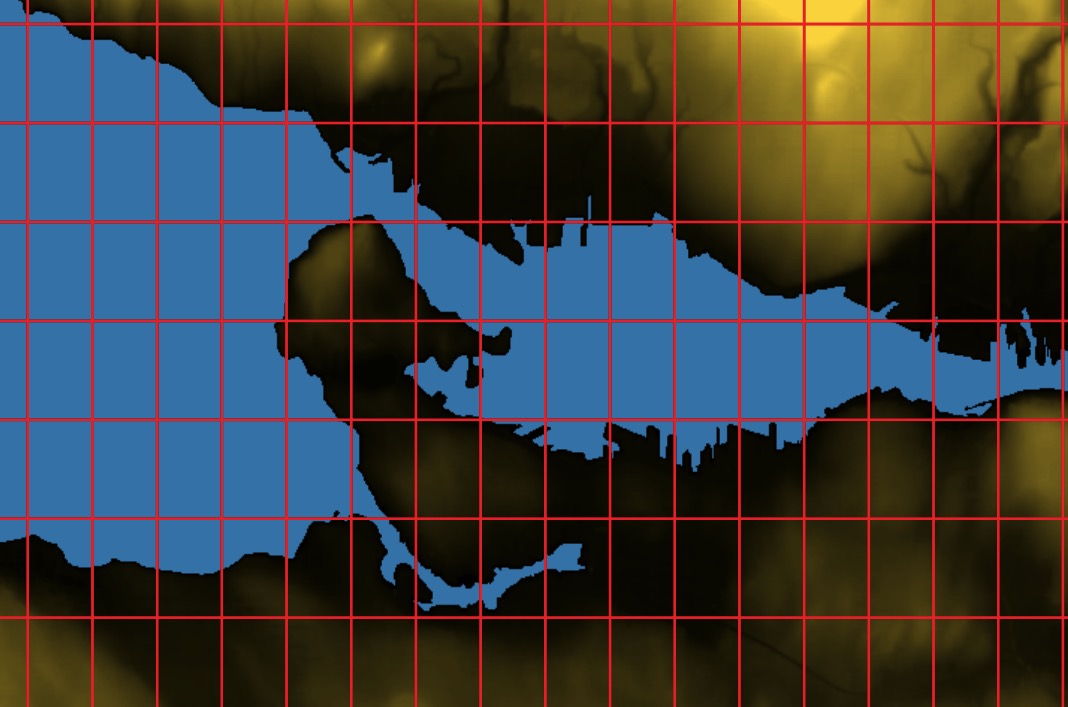
raster2pgsql -I -F -s 4269 -t 56x56 092g06_e.dem dem092g06e | psql yvr_raster
After the data load, we have a table of 56-by-56 pixel elevation chips named dem092g06e. If you map the extents of the chips, they look like this:
Imagine a sealevel rise of 30 meters (in an extreme case, Greenland plus Antarctica would be 68 meters). How much of Vancouver would be underwater? It’s mostly a hilly place. Let’s find out.
CREATE TABLE poly_30 AS
  SELECT (
   ST_DumpAsPolygons(
    ST_SetBandNoDataValue(
     ST_Reclass(
      ST_Union(rast),
      '0-30:1-1, 31-5000:0-0', '2BUI'),
     0))).*
FROM dem092g06e d
There are a lot of nested functions, so reading from the innermost, we:
- union all the chips together into one big raster
- reclassify all values from 0-30 to 1, and all higher values to 0
- set the “nodata” value to 0, we don’t care about things that are above our threshold
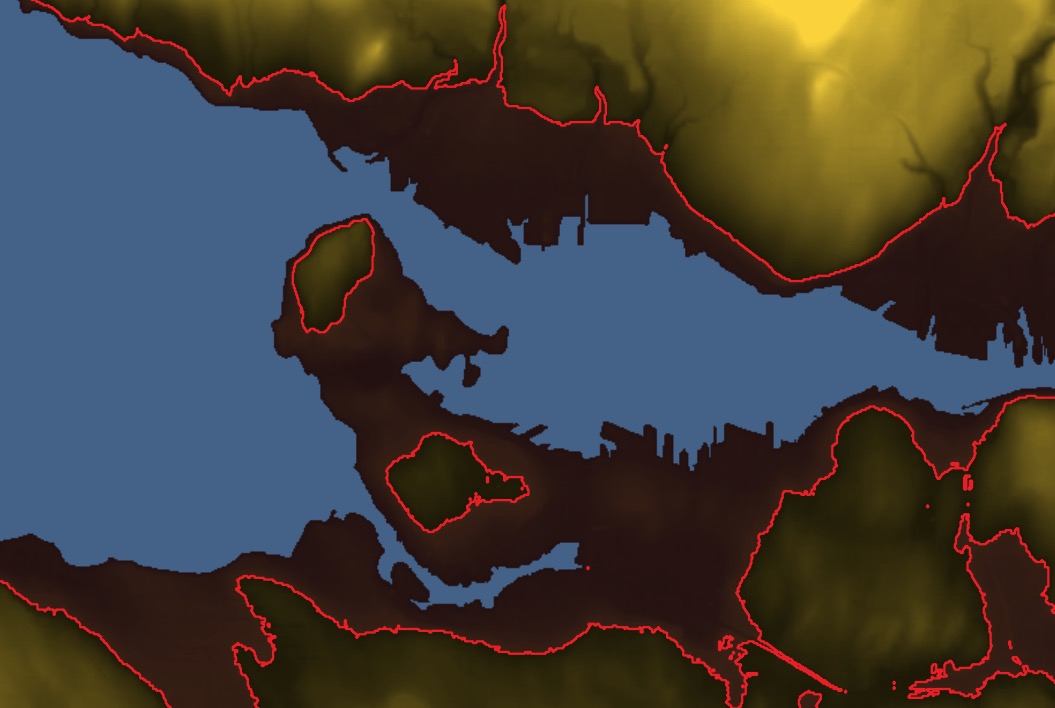
- create a vector polygon for each value in the raster (there only one value: “1”)
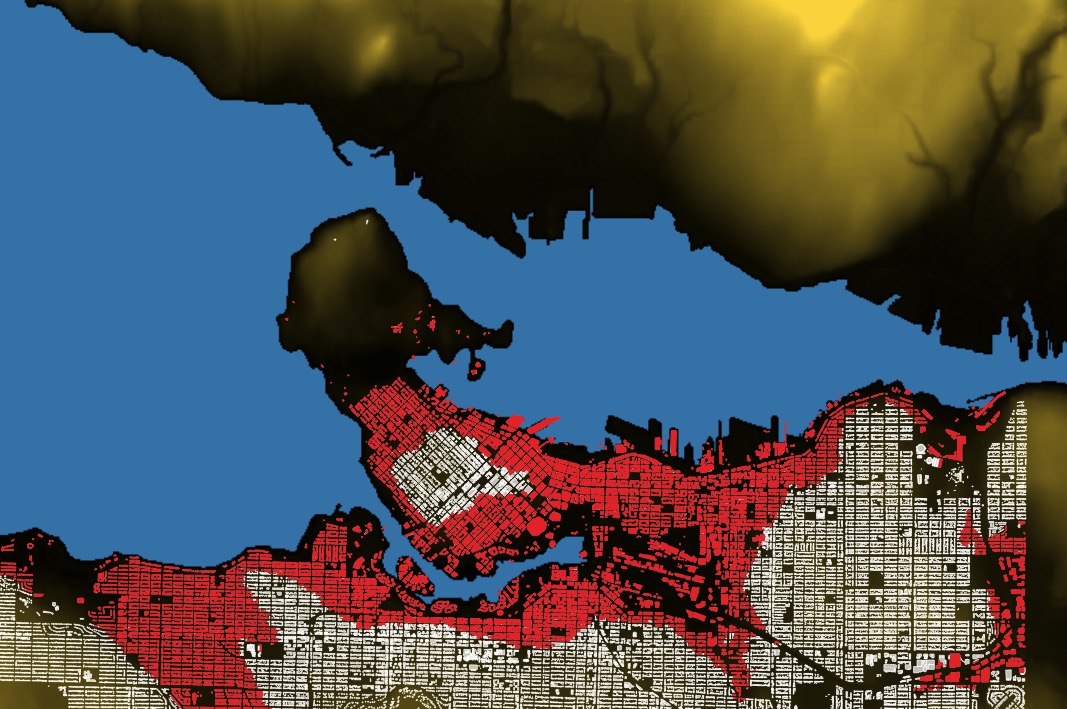
The result looks like this:
We can grab building footprints for Vancouver and see how many buildings are going to be underwater.
# Vancouver open data
# https://data.vancouver.ca/datacatalogue/buildingFootprints.htm
wget ftp://webftp.vancouver.ca/OpenData/shape/building_footprints_2009_shp.zip
unzip building_footprints_2009_shp.zip

# Options: create index, SRID is 26910, use dump format
shp2pgsql -I -s 26910 -D building_footprints_2009 buildings | psql yvr_raster
Before we can compare the buildings to the flood zone, we need to put them into the same projection as the flood zone (SRID 4269).
ALTER TABLE buildings
ALTER COLUMN geom
TYPE geometry(MultiPolygonZ, 4269)
USING ST_Transform(geom, 4269)
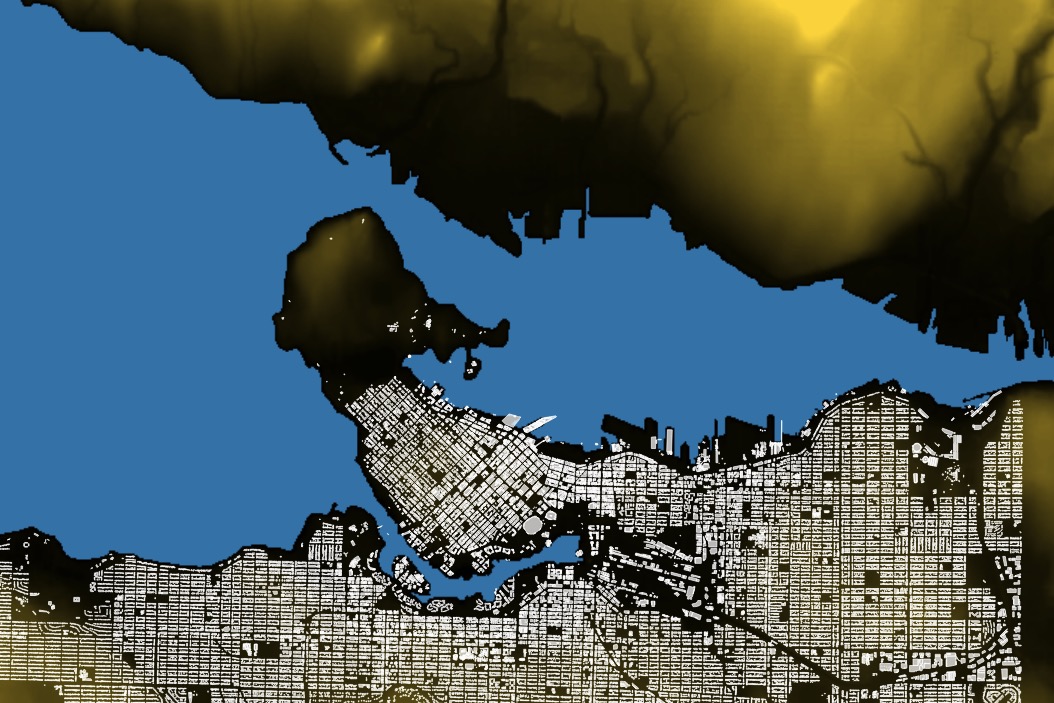
(There are buildings on the north shore of Burrard inlet, but this data is from the City of Vancouver. Jurisdictional boundaries are the bane of geospatial analysis.)
Now we can find flooded buildings.
CREATE TABLE buildings_30_poly AS
  SELECT b.*
    FROM buildings b
    JOIN poly_30 p
      ON ST_Intersects(p.geom, b.geom)
    WHERE ST_Intersects(p.geom, ST_Centroid(b.geom))
There’s another way to find buildings below 30 meters, without having to build a polygon: just query the raster value underneath each building, like this:
CREATE TABLE buildings_30_rast AS
  SELECT b.*
    FROM buildings b
    JOIN dem092g06e d
      ON ST_Intersects(b.geom, d.rast)
    WHERE ST_Value(d.rast, ST_Centroid(b.geom)) < 30;
Since building polygons from raster can be expensive, joining the raster and vector layers is usually the way we want to carry out this analysis.
For bringing continuous data (elevations, temperatures, model results) into GIS analysis, the postgis_raster extension can be quite useful.