08 May 2024
Back to entry 1
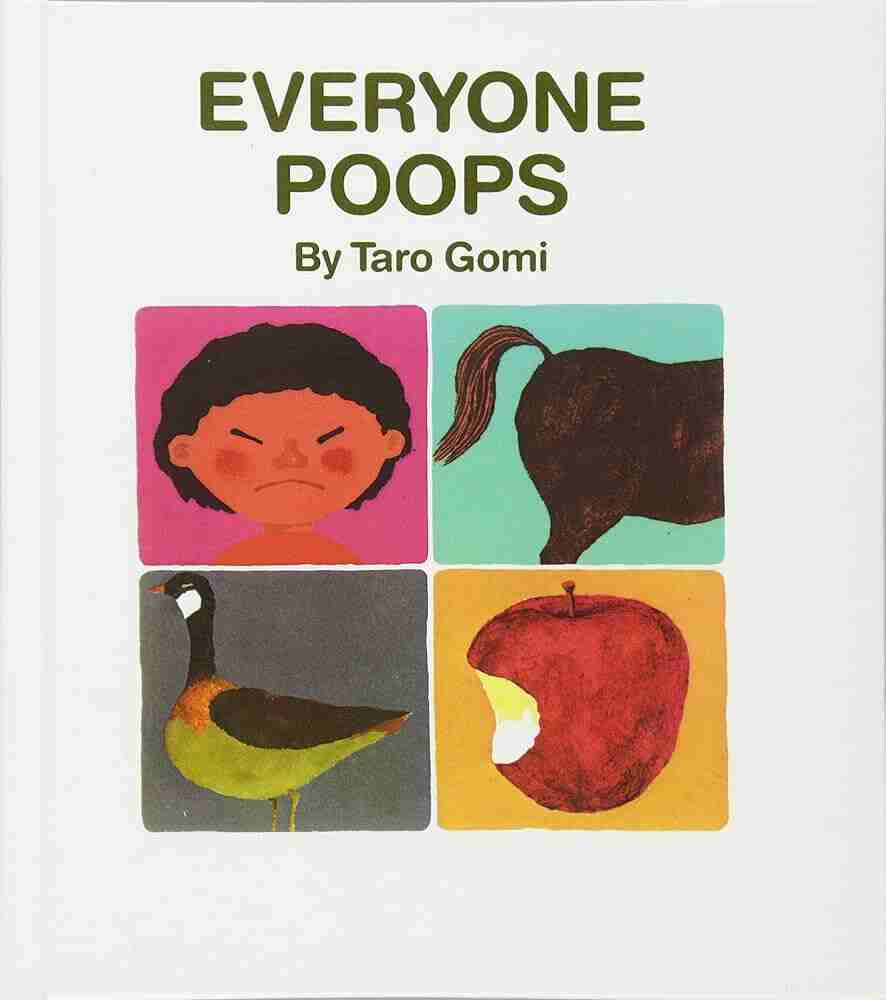
I have a profoundly embarassing cancer. Say it with me “rectal cancer”. “Rectal cancer”.
Why is it embarassing?
Poop!?! Maybe we are all still six, somewhere deep inside.
When Ryan Reynolds got a colonoscopy on camera, to raise awareness of colorectal cancer screening, part of the frisson of the whole thing was that yes, somehow having this procedure done is really embarassing.
So, watch the video, it’s really nothing but an ordinary medical procedure that could very well save your life. And Ryan Reynolds is charming.

Meanwhile, colo-rectal cancers remain tough to talk about, because frankly the colonoscopy is the least of it.
Not having control of your bowels is, well, really embarassing in our culture. What do people say about elderly presidential candidates they hate? They call them incontinent. They intimate that they wear adult diapers (gasp!).
Do you know who else gets to wear adult diapers? Colorectal cancer patients. We get our insides man-handled, irradiated and chopped up, and the results are not great for bowel control. It happens if you’re 55, it happens if you’re 35. It’s normal, it’s usually temporary, it’s what happens when you insult a GI tract badly enough.
Another rite of passage in treatment is the ostomy. Stage III rectal cancer treatment usually involves a temporary ostomy, after radio-chemotherapy during the resection of the part of the rectum that holds the tumor. Patients with a low (near the anus) tumor location will sometimes require a permanent ostomy, because the tumor cannot be removed without damaging the anus.
When I was diagnosed, I was initially terrified of the ostomy. “The bag.”
After researching the different treatments, I got a lot less terrified, since the side effects of some non-bag outcomes in terms of quality of life can be pretty terrible. Meanwhile folks with ostomies are out hiking, biking, and swimming.
If this talk is all a little uncomfortable, may I recommend a colonoscopy?
And after that, a big meal and some poooooping! Poop! Poop! Poop!
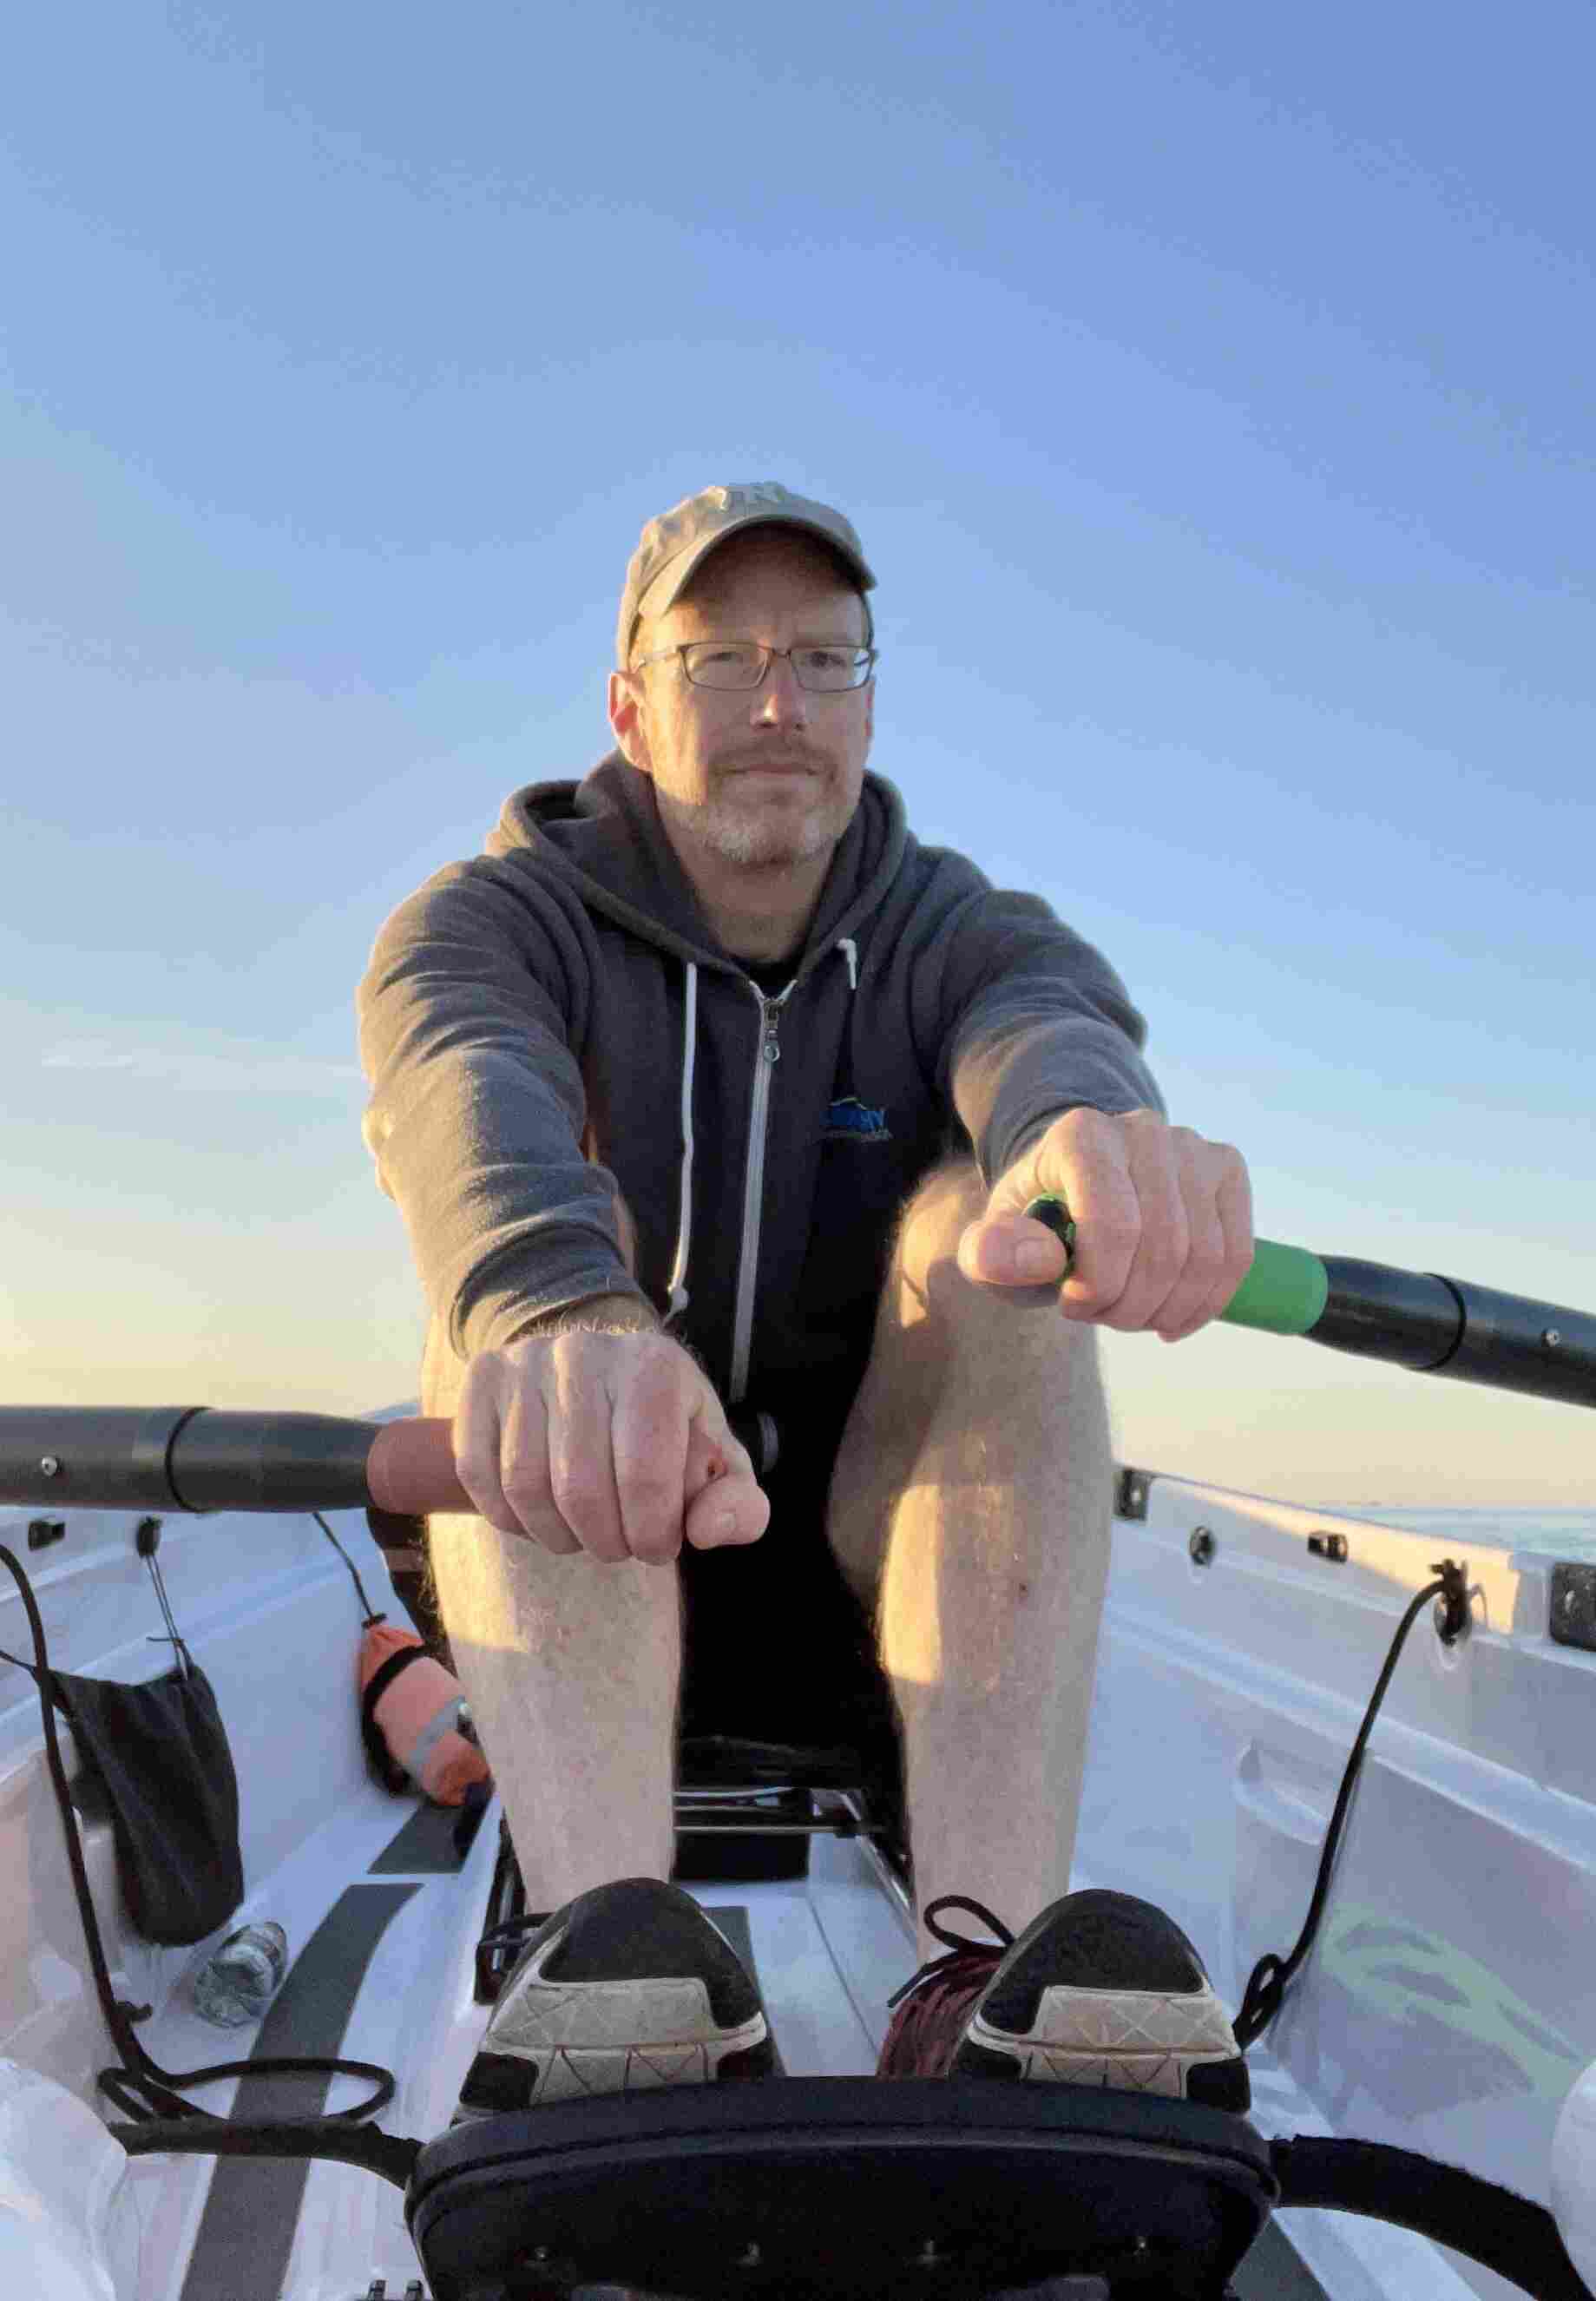
I’m in a pooping mood because my surgery (2 weeks ago now) has left me, not incontinent, but I guess “disordered” is a better word. You know how it feels to really need to take a dump? Imagine feeling that 12 hours a day, even when you don’t actually have anything to dump.
By most measures I think I am ahead of the median patient in recovery from LAR surgery, but unfortunately the recovery time for things like bowel regularity and “normalcy” (the “new normal” will always be somewhat worse than the “old normal”) is measured in months, not days, so I am a little impatient to improve more, and faster.
Talk to you again soon, inshalla.
05 May 2024
Back to entry 1
“Anything that’s human is mentionable, and anything that is mentionable can be more manageable. When we can talk about our feelings, they become less overwhelming, less upsetting, and less scary. The people we trust with that important talk can help us know that we are not alone.”
– Fred Rogers
When I found out I had rectal cancer, I hit the internet hard and immediately found the ColonTown community of communities. It has turned out to be simultaneously the most reassuring and the most anxiety producing place on the internet for me.
On the reassuring side, even though colorectal cancer is third most prevalent cancer world-wide, it is not widely talked about, so the community was reassuring: there are other people out there going through this; many are already through it.
There are also a lot of aspects of the rectal cancer treatment process that the medical system seems ill-equiped to support. I was sent home from major surgery with very little guidance in hand about expected recovery progression, or diet. Fortunately the community was a great resource for this information.
On the anxiety producing side, let me start with this meme.
The population of a community like ColonTown is necessarily going to bias towards people who are currently in treatment and the population of people currently in treatment will bias toward folks whose treatment is not necessarily getting them cured.
Survivorship bias in this case manifests in the survivors slowly draining out of the community, leaving behind mostly folks still actively in treatment.
There are a lot of people in Stage IV, keeping fucking going, who have harrowing tales. And there are people who were Stage II (like me) who against the odds progressed to Stage IV. It happens. And the thought that I could follow that path too, is frankly terrifying.
Anyways, as a result, reading posts from this wonderful supportive online community can sometimes throw me into a spiral of anxiety, because oh my god I have this terrible deadly thing. Which I do. But also probably I am going to be fine.
Probably?
Talk to you again soon, inshalla.
02 May 2024
Back to entry 1
I’m still here.
There’s nothing like spending some time in hospital to get a visceral reminder that “well, things could be a whole lot worse”. There are plenty of people dealing with far more dire scenarios than a little surgical recovery with a discharge in a handful of days.
My stay was scheduled for 3-5 days, and I was discharged in 4, a testament to my good health going in and the skill of my surgeon in doing the least harm while still doing what needed to be done.
It was still a long and eye-opening four days.
Psychologically, the worst time was the 24 hours before they put me under. Fasting, and hard antibiotics, and bowel prep, and anticipation, and an early start. I shed some tears in the pre-op while waiting to roll into the OR, for sure.
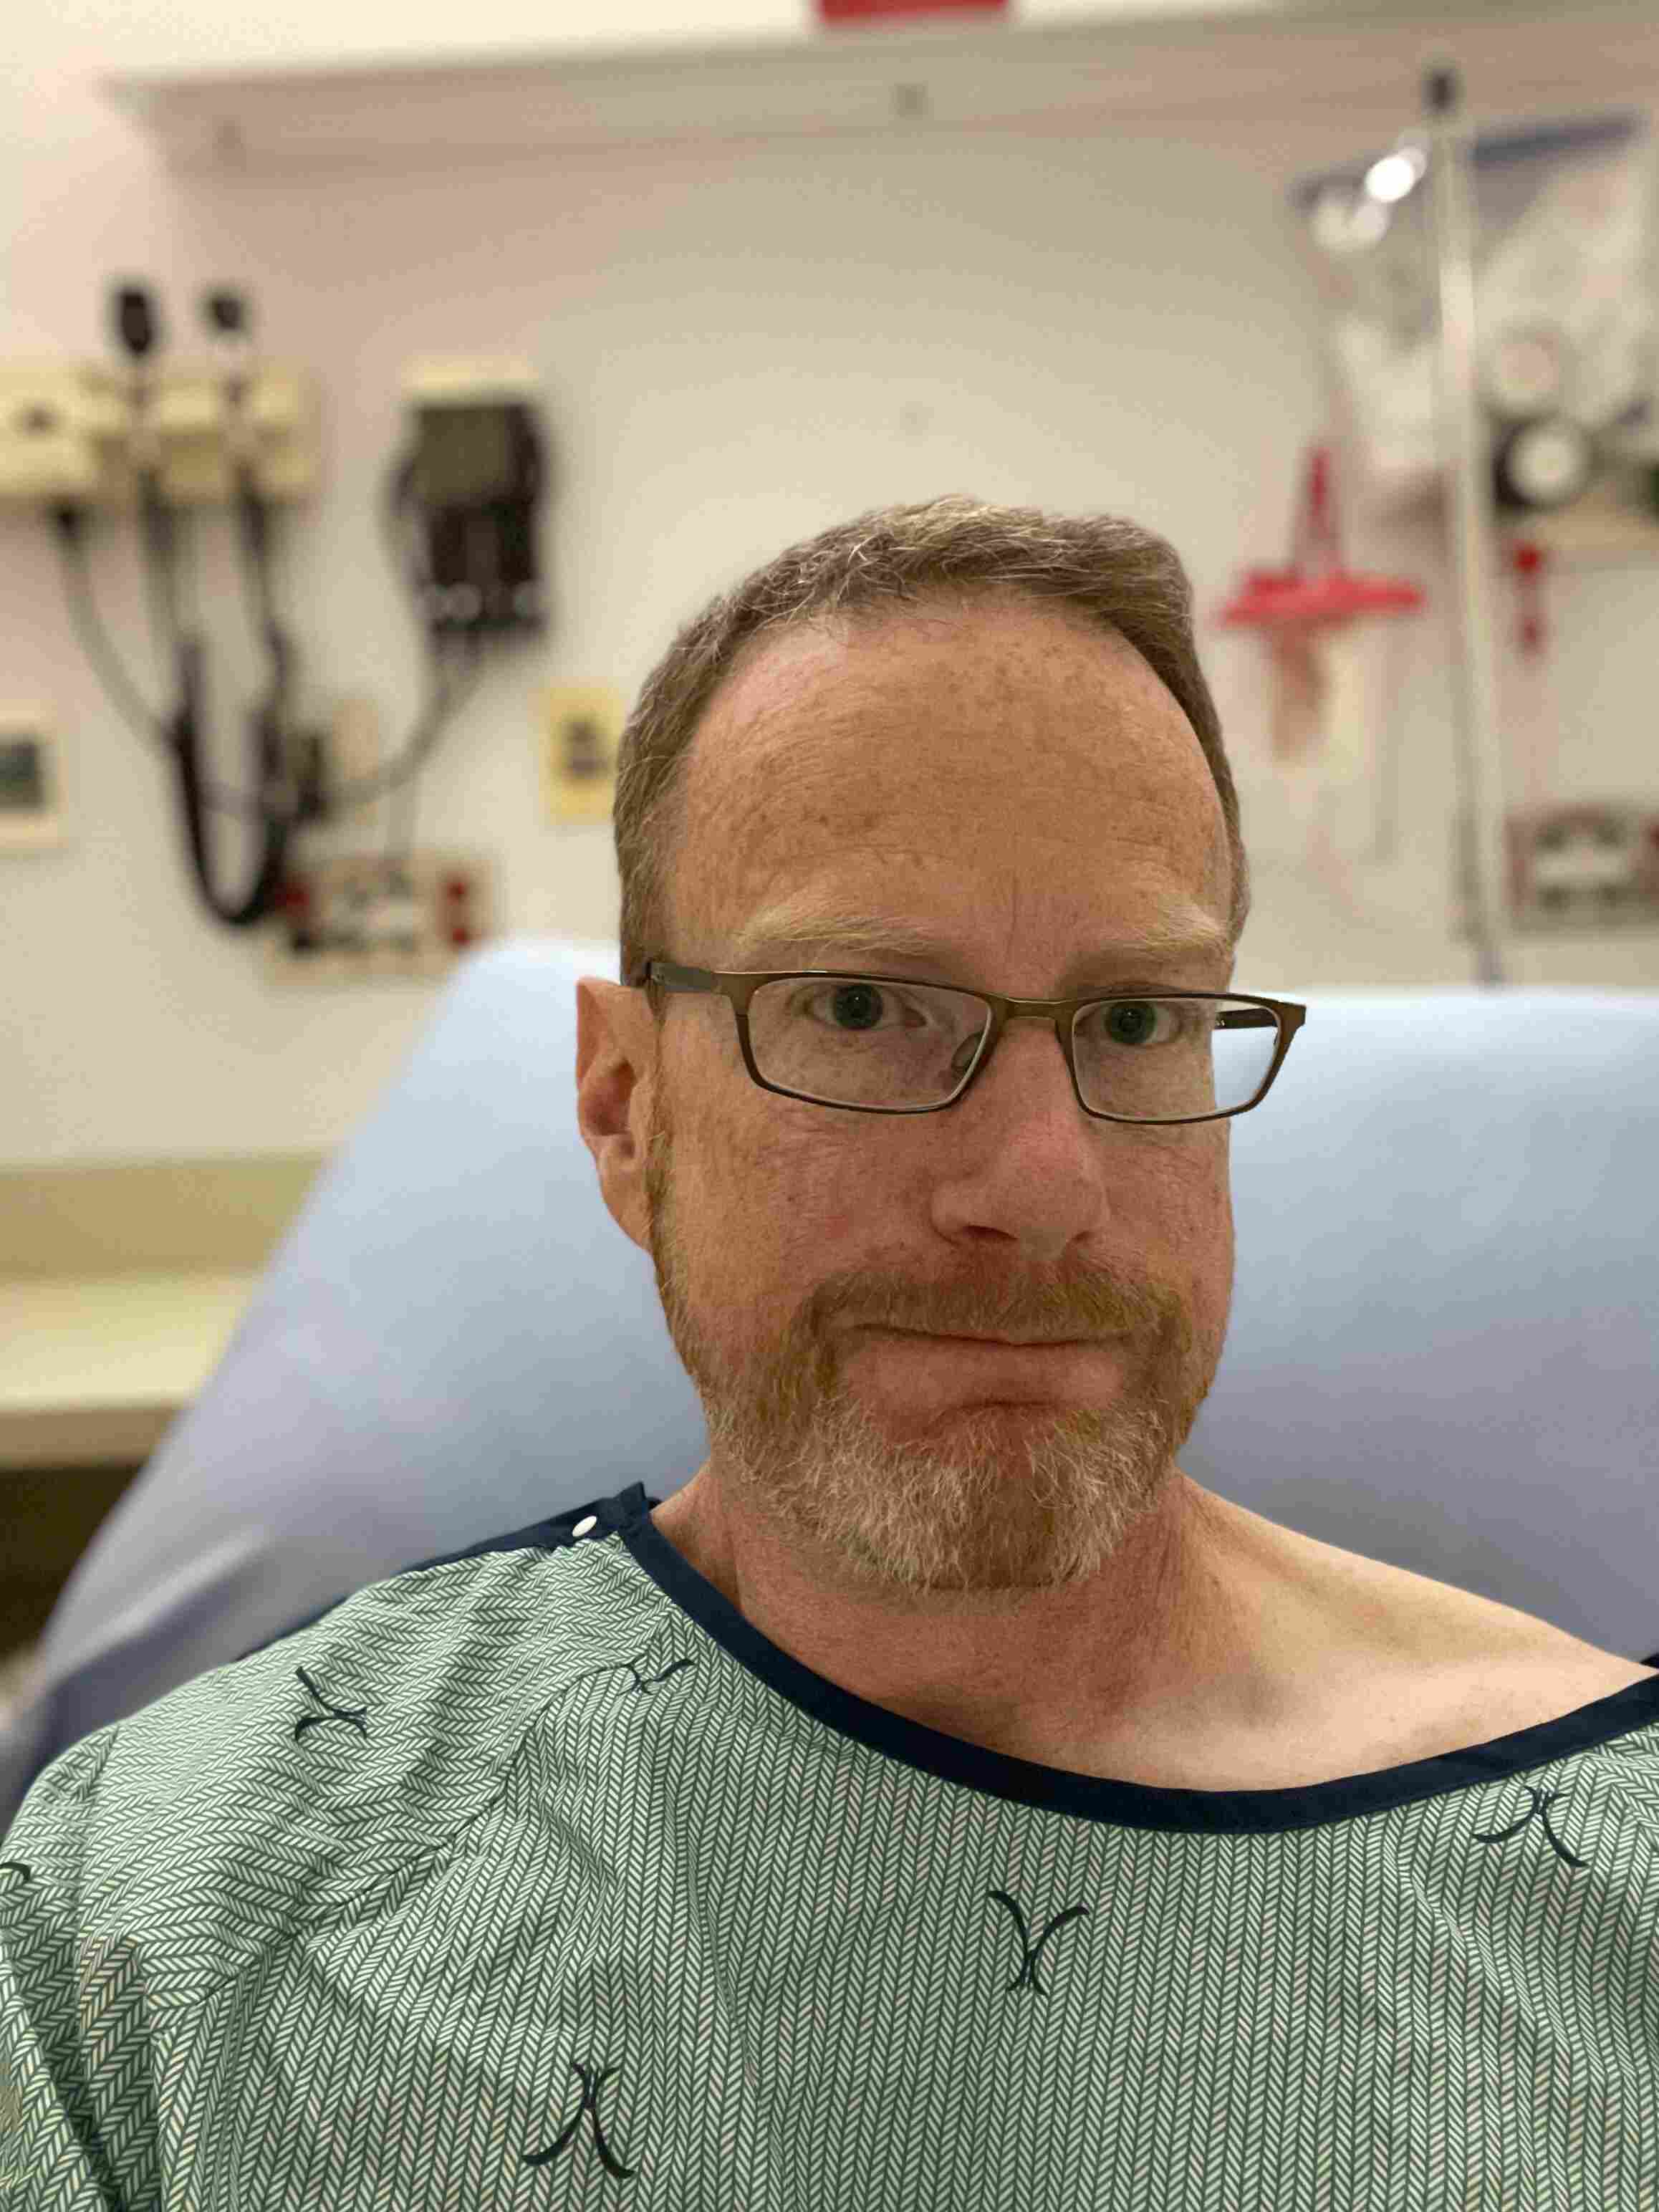
The four days of recovery in hospital included all sorts of new indignities, from catheterization to shitting the bed, from adult diapers to the generalized humiliation of being unable to move, pinned down by gravity and pain. Good personal growth moments. This is staying alive, in all its messiness, a process of continuous compromise and self-adjustment.
Now I have two recoveries to work on.
The near term one is healing from the surgery. They put a breathing tube down my throat, catheterized me, cut six little port-holes into my abdomen to stuff laproscopic tools through, inflated my abdominal cavity so they could see what they were doing, cut out the majority of my rectum and the surrounding lymph nodes, stapled the sigmoid colon to whatever rectum was left, inflated my bowel to test that joint, and then closed me back up again. My middle is in rough shape. But it should all recover to more-or-less its previous strength, over several weeks.
The longer term one is how my GI system adjusts to missing several critical centimeters at the end. This is where permanent changes loom, the bits that worry me. How long I can go between trips to the bathroom and how much control I have over things when I need to, are recovery processes that will play out over several months.
So far, for someone in their first week of recovery, I think I am doing well.
I am trying not to worry too much about the whole cancer part of this journey, which is still in the grey area until we get pathology back on the parts they took out of me. That will determine whether I am due for several months of post-operative chemotherapy, or move directly to monitoring.
Talk to you again soon, inshalla.
21 Apr 2024
Back to entry 1
This is probably my last posting before I go in for surgery and start my new life as a “patient”.
I was talking with a friend, and we were laughing at how “patient” has the dual meaning of forebearance and under medical care. We didn’t pull out our phones and find out that it is also from the Latin, for “suffering”.
Anyways, suffering is definitely part of life in CancerLand, and surely a reason why we are culturally so frightened of it, even when prognosis is good. Some measure of suffering will be extracted, on the way through, and that’s if you are lucky.
A poster on the groups shared that she felt angry, when talking to civilians about their “troubles”. She wanted to scream at them, “well at least you don’t have cancer!”
Someone responded, “the healthy man desires many things, the sick man desires only one thing”. Which seemed the most pithy perspective.
I shared that I felt a little guilty posting about my own mental state, dealing with a stage two diagnosis, in a forum frequented by many people in stages three and four. And people were fairly uniform in saying, there is something about hearing the words, “you have cancer”, that marks a sharp dividing line in ones life, no matter what the physical progression is.
Surgery will be my first sharp physical dividing line. Hopefully also my last, but as usual the grey area is in effect.
Talk to you again soon, on the other side, inshalla.
18 Apr 2024
Back to entry 1
Cancer is a mind fuck.
I mean, it’s a body fuck too, obviously, but the early experience for me has been of weird gyrations of mental health and mood with each passing day.
The first thing I did was the first thing everyone does – look up all the different probabilities of five year survival, because that’s what is at the top of the Google search.
With a stage two diagnosis (hard to know if that’s actually what I have, though) Google says I have a 10% chance of dying over the next five years.
That feels like… a lot? A scary amount.
But wait, here’s a fact – my odds of dying just in the ordinary course of affairs over the next five years are about 4.5%.
Does that stop me from being 1000% more terrified, on a daily basis, since receiving my diagnosis? No it does not.
A good deal of that terror, I think, is that cancer promises a patient a long and painful interaction with a medical system that has only destructive rear-guard actions at hand to stop it. Cut things out; kill it with poison; zap it with radiation. These procedures all leave a body worse for wear, and if they don’t work… they bring you back and do some more of them.
My great grandfather died while rolling a ball on the lawn bowling green in his late 80s. Massive stroke, he died doing something he loved and was dead before he hit the ground. Floyd Ramsey hit the mortality jackpot.
Naturally, I would also like to hit that jackpot. Cancer says, “not so fast, you might have a different life experience ahead of you”.
It would be a little too pat to say that getting a diagnosis starts you off on the stages of grief, because that implies some orderly process to the mental evolution. I am not progressing linearly through the stages of grief, so much as visiting them randomly, over and over, in an emotional shuffle mode.
Some days are denial days. Some days are acceptance days. Some days are bargaining days.
I told my councillor last week that “I only feel OK to the extent that I am dissociative”, and that seems to still hold true. I am at my most together when I have fully distracted myself from the diagnosis. I’m not sure if this counts as “taking one day at a time”. Probably not.
Talk to you again soon, on the other side, inshalla.


